The short definition of a physical map: a physical map shows the physical features of an area, such as mountains, hills, plateaus, plains, valleys, rivers, lakes, deserts and coastlines, rather than the area’s political situation. Physical maps show elevation and relief with the help of color. Darker greens sit at near-sea-level ground, grading through tans and browns to grey on the highest peaks.
Ninety maps and two plates of statistical charts. That is the size of Heinrich Berghaus’s Physikalischer Atlas, begun at Alexander von Humboldt’s request in 1827, published in instalments from 1837 to 1848, and recognised by Atlaseum as the first thematic atlas ever published. That atlas contains the definition in question. In this atlas, the word “physical” means the nineteenth-century term used in physical geography: the study of the land itself. It has nothing to do with paper. This term is widely misinterpreted these days, and, unfortunately, this misinterpretation is quite prevalent — because paper is exactly what most people now mean when they say it.
So now the judgement on which maps you actually want …
- Physical map — you want to see the major features of a large area at a glance.
- Political map — you want borders and capitals and roads and not terrain at all.
- Topographic map — you want to plan a route on an actual slope.
- Relief map — you are describing a technique, not a fourth category.
Physical map definition: what it shows, and what it leaves out
A physical map answers the question: what does the land look like here? Who owns it? How to get across it? Those are different questions. A physical map does not answer those questions. A physical map just shows the land shape.
Six words carry the rest of this page. A landform is a mountain, hill, plateau, plain, valley, basin, butte, or canyon. Elevation is the height above sea level. Relief is the difference in elevation between the low and high ground. Topography is the overall shape of the land surface. The legend (or key) tells you what each color and symbol means. The scale tells you how far a distance on the map corresponds to how far that distance is on the land.
Dictionary.com defines the term as a cartographic representation illustrating the natural landscape features of an area, such as mountains, rivers, lakes and elevation — and lists road map and political map among its antonyms. With that definition and that antonym pairing, we have a quick way to remember this idea: a physical map leaves out the human layer, a political map shows the human layer, and a road map shows the transportation layer.
What you get instead is land and water. Deserts, Islands and coastlines are labeled. Rivers, Lakes, Seas and Oceans are colored, typically, lighter colors represent shallower water and darker colors represent deeper water, which is where bathymetry shows up on the map. Many physical maps add shaded relief, to simulate light and shadow across the land, so that even a flat sheet reads as three-dimensional. Geology.com notes that physical maps are best known for showing topography, either through colour or as shaded relief. Other features like, borders, roads and city names are shown, if at all, very faintly. The payoff is that you can easily read the Himalayas, The Andes, The Rocky Mountains, The Amazon River and The Great Lakes all in one glance.
Two other interpretations of the phrase have been established, “paper, not digital” and “genetics.” I will cover them both, below.
What the colours mean, and why green is the most misread colour in cartography
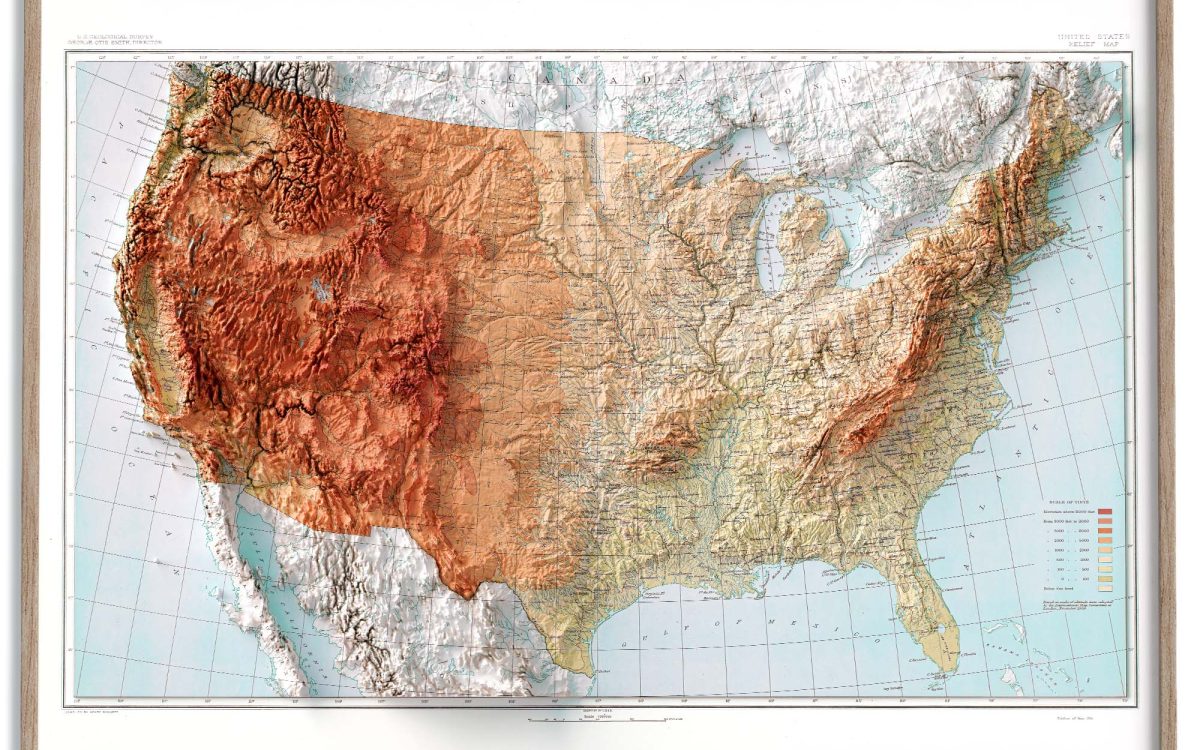
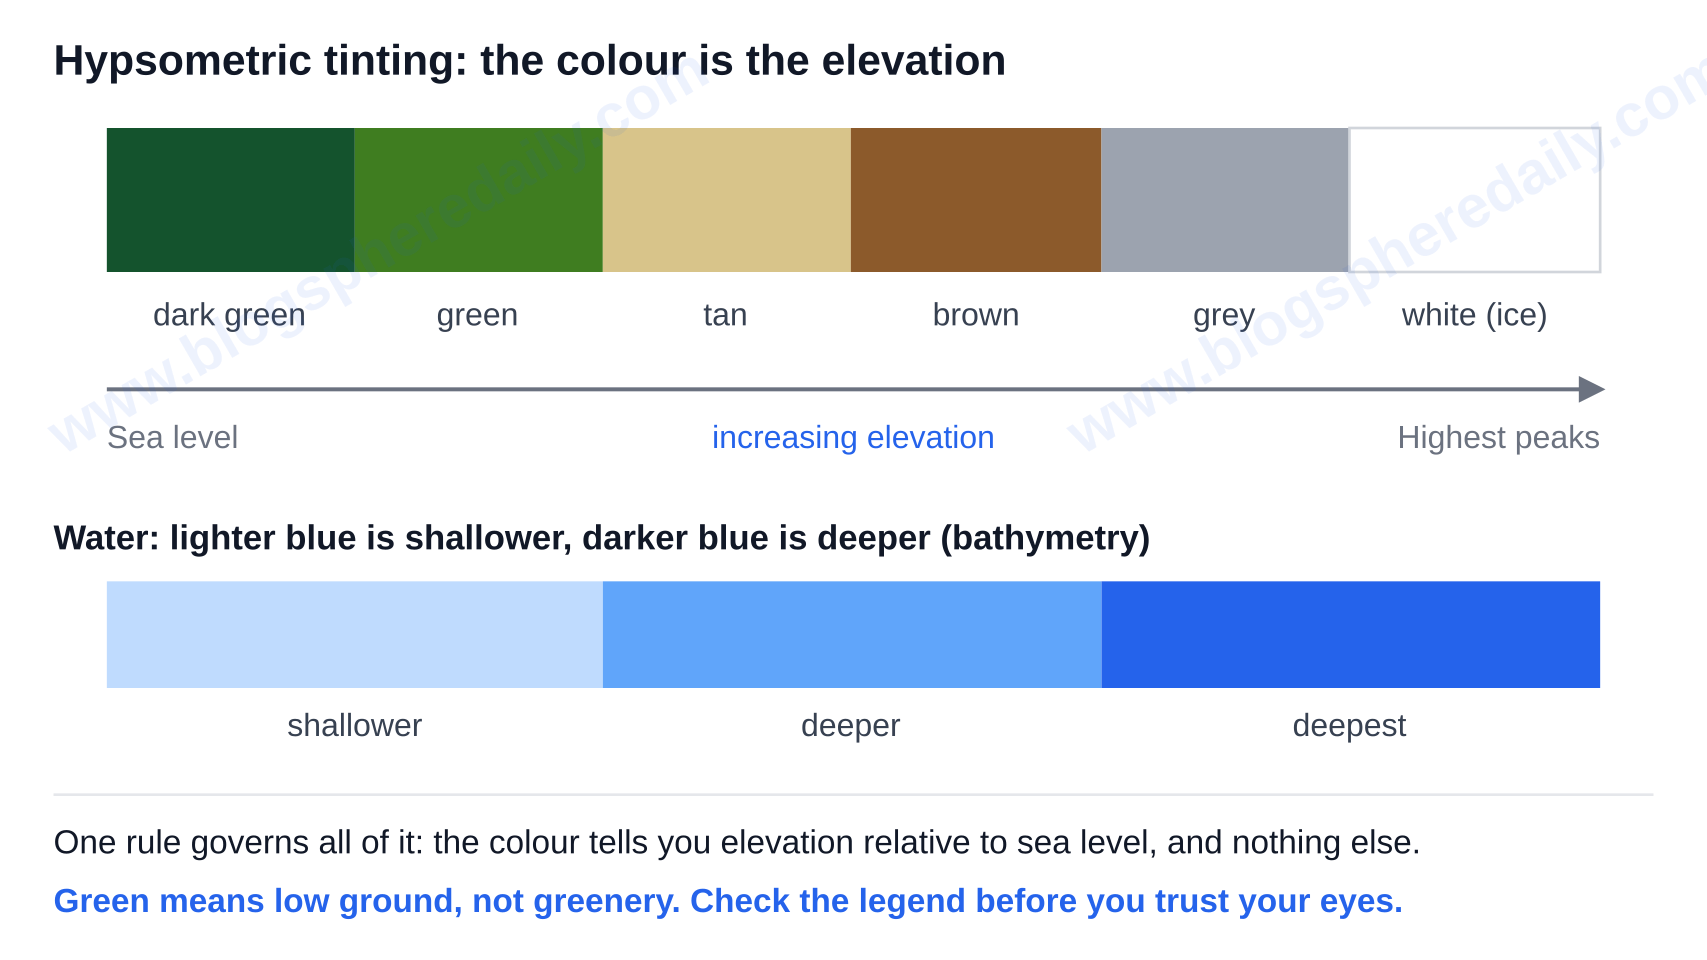
The standard ramp is called hypsometric tinting. Dark green represents areas near sea level and gradually changes to tans and browns with increasing elevation, and ultimately to grey and white at the highest elevations. Water and lakes are represented by light blue, and darker shades of blue represent deeper water. White also marks permanent ice.
One rule governs all of it, the colour tells you the elevation relative to sea level, and nothing else.
The green is not grass
This is the most common mistake in map reading and is documented rather than anecdotal. Tom Patterson and Bernhard Jenny, writing in Cartographic Perspectives in 2011, discuss a concern in the mapping community of a confusion of hypsometric tints and environmental phenomena like vegetation and climate. Due to the color green representing living things, low-lying arid areas around the Persian Gulf for example, are interpreted as lush forest, while higher regions that may be forested are drawn in colors such as orange-brown or grey and are thus read as barren.
Any physical map definition that ends at “green for lowlands, brown for highlands” sets up the reader to make the same mistake. Patterson and Jenny suggest the use of hypsometric tints that are cross-blended, which replace one global green-to-brown ramp with lowland colours tailored to each region, and say that such data are available free as raster data through Natural Earth’s 1:10m cross-blend dataset. In practice, newer maps show deserts in sandy tones, and older wall maps in classrooms need to be read with legend in hand. Color bands for elevations are set by the publisher and can vary. So a reader’s instinct for elevation representation can be misleading — the key, not your instinct, decides which elevations a tint represents.
The newer meaning: paper, not digital
This is usage drift, based on evidence rather than presumption. Example sentences attached by dictionary.com to the term show a citation from the Los Angeles Times in 2026, where the author states ‘a physical map was not available’ at a venue, as well as a BBC citation from 2022, where the author states ‘he brought along a paper map’ before smartphone navigation, both show the phrase is used to refer to a tangible paper map rather than a digital one. The definition given in the dictionary entry does not cover this meaning.
So, in the context of a geography lesson, the phrase means ‘landforms’. However, in everyday use, the phrase tends to mean ‘paper, not my phone’. Understand which one the speaker means before replying.
Physical map vs political, topographic and relief maps
A single question covers all four terms at the same time, and it is not ‘what does it show?’ It is ‘how does it show elevation?’
| Map type | How elevation is encoded | What it carries | Best for | Where it falls short |
|---|---|---|---|---|
| Physical map | Colour gradient (hypsometric tints) and/or shaded relief | Landforms, rivers, lakes, coastlines; borders faint or absent | Seeing the major features of a large area at a glance | No precise heights; too coarse for navigation |
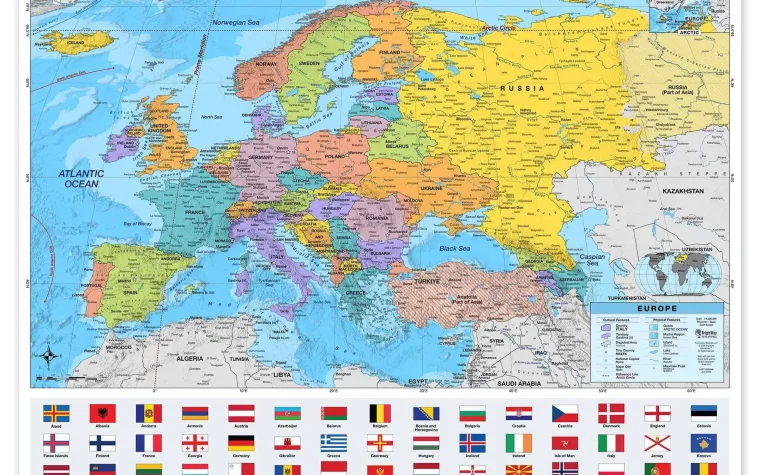
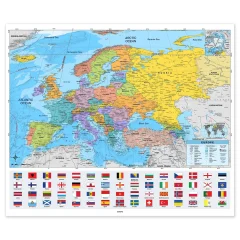
| Political map | Not encoded at all | Country, state and county boundaries, roads, cities, major water | Governance, administration, travel between places | Tells you nothing about the terrain in between |
| Topographic map | Contour lines of equal elevation at a fixed contour interval | Contours, spot heights, trails, structures, water | Route-level detail — closely spaced lines mean steep ground | Harder to read quickly; covers a small area per sheet |
| Relief map | Shading that simulates light and shadow (or a raised 3D model) | Terrain texture, usually layered under another map type | Making slopes intuitive to a non-specialist | Not a separate category — it is a technique |
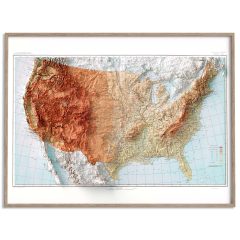
The physical map’s case. It is unrivaled in regional perspective. A quick look at the United States shows the Rocky Mountains, Appalachians, and Sierra Nevada in dark brown; the Plateaus of Colorado and Columbia and Ozark; the Great Plains and Mississippi valley, in green; the Great Basin; the Sonoran and Chihuahuan Deserts, point features like the Grand Canyon, Death Valley and Niagara Falls; and more. A physical map gives a general idea, but a topographic map provides exact figures. A tint gives you a band, not a number.
The political map’s case. It’s the map you grab alongside an explainer on the alliances that shaped WW1, for instance, where the borders are the entire story, and where it is the map that answers the human, rather than the geological, question. Its colours separate units; they never signal height.
The topographic map’s case. Contour lines are the only one of these encodings precise enough to plan a climb. You will read several sheets of a topographic map to plan a climb where you would use a single physical map.
The relief map’s case. It is not a rival. Relief naming encompasses the shading technique, and physically, it is raised three-dimensional models. That is why the two terms are used interchangeably. The Synonyms of physical map, as per Dictionary.com, are relief map and topographic map. Thus, expect imprecise or ordinary usage, even where cartographers draw the line.
What is a physical map in biology and genetics?
The definition of a physical map in geography does not apply in biology or genetics at all. In molecular biology, the National Human Genome Research Institute defines a physical map as a graphical representation of the physical locations of landmarks or markers — genes, variants and other DNA sequences of interest — within a chromosome or genome.
Measurement defines contrast. A physical map measures distance in actual numbers of base pairs or in overlapping cloned fragments (contigs). Genetic and linkage maps measure distance in terms of recombination frequency. High quality physical maps of each human chromosome were constructed prior to completion of the sequence itself during the Human Genome Project, and a complete genome sequence itself is a physical map. The main techniques used to construct physical maps are fluorescent in situ hybridization (FISH), and restriction site mapping and sequencing by clones.
One second is all it takes to sort which sense you need. If it’s chromosomes, markers or base pairs, go with this sense. If it’s mountains, rivers and elevation, it’s the geography sense.
Which map to choose
A physical map is the best choice when you want to understand a landscape — classroom geography, watersheds and reasons for the placement of human settlements in a particular area, environmental science relating elevation and drainage to climate and water supply, geology spotting mountain belts and river basins, or orienting a visitor at a park visitor centre. A topographic map is appropriate to answer route-level questions, i.e. which way down, which gradient, which slope. A political map is the best choice when the question asks for location of a capital, border, or road. In 2026, a person likely wants a printed map if they ask for a physical map at a venue.
A note on interpretations: Green means low ground, not greenery. Check the legend before you trust your eyes.